Functional Skills Maths Charts eLearning Course
Overview
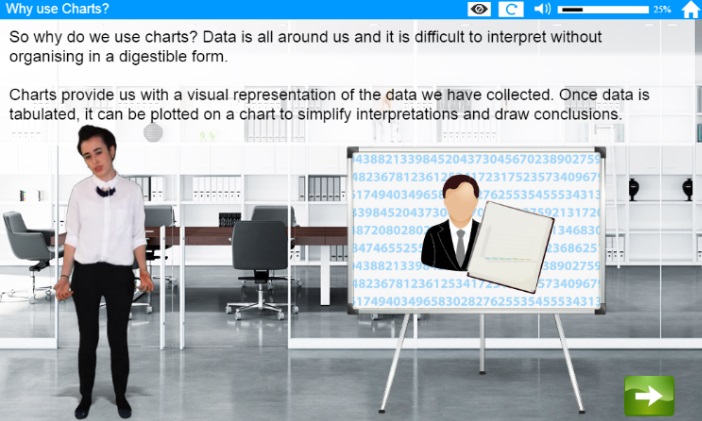
Learn more about charts, why they are useful and which charts to use to represent data. The course also includes worked examples of interpreting charts.
Learning Objectives/Outcomes
- What charts are used for
- Learn how to interpret different charts
- Understand the best use of charts to represent data
- Practice real life examples
Target Audience
Business and corporate

This course has a minimum of 25 learner registrations for us to provide a quotation.
Request a Quotation- Language
- UK
- Date last updated
- 12/3/2018
- Duration
- 1 Hour
- Suitable Devices
-
- PC
- Phone
- Tablet
- Audio is Required
-
- Yes
- Includes Video
-
- Yes
- Downloadable Resources
-
- No
- Completion Criteria
-
- Pass final test
- Visit all pages
- Pass Mark
-
- 70% pass mark required
- Course Technology
-
- HTML5
- SCORM 1.2
- Can be customised
-
- Available at an Additional Cost
- Accreditation or Endorsements
-
- CPD
- Languages
-
- Available at an Additional Cost
- English
